
Bioinformatics Core
The Bioinformatics Core at Meharry Medical College provides advanced computational biology support for the analysis, integration, and interpretation of complex biomedical data. We aim to empower researchers with the tools, expertise, and training needed to extract meaningful insights from high-dimensional biomedical datasets.
Core Focus Areas
- Multi-Omics Data Integration
Analysis across genomics, transcriptomics, and proteomics, to support systems biology and precision medicine. - Biomedical Informatics
Integration of clinical and biomedical datasets, including EMR queries, phenotype validation, and support for translational research. - Biological Network Analysis
Construction and interpretation of gene, protein, and multi-omics networks to uncover regulatory and functional relationships. - Custom Analytics & Training
Hands-on training in bioinformatics tools, data analysis workflows, and data visualization techniques, tailored to the needs of researchers at all experience levels.
The Bioinformatics Core collaborates closely with: Genomics Data and Proteomics cores:
Collaborative Approach
Genomics Data Core – for next-generation sequencing (NGS) services and raw data generation
Proteomics Core – for mass spectrometry-based protein analysis and post-translational modification studies
Together, we provide end-to-end support from experimental design to biological insight.
Contacts

Jeffrey Leegon
Director, Biomed Informatics
Co-Director, Bioinformatics Core
jleegon@mmc.edu

Siddharth Pratap, Ph.D.
Associate Professor
Director, Bioinformatics Core
spratap@mmc.edu
For reservations and a free consultation, register on the Meharry iLab site iLab Organizer :: login.
GRAPHICS Citation: Cooley A, Rayford KJ, Arun A, Villalta F, Lima MF, Pratap S, Nde PN. Trypanosoma cruzi Dysregulates piRNAs Computationally Predicted to Target IL-6 Signaling Molecules During Early Infection of Primary Human Cardiac Fibroblasts. Immune Netw. 2022 Dec;22(6):e51. https://doi.org/10.4110/in.2022.22.e51
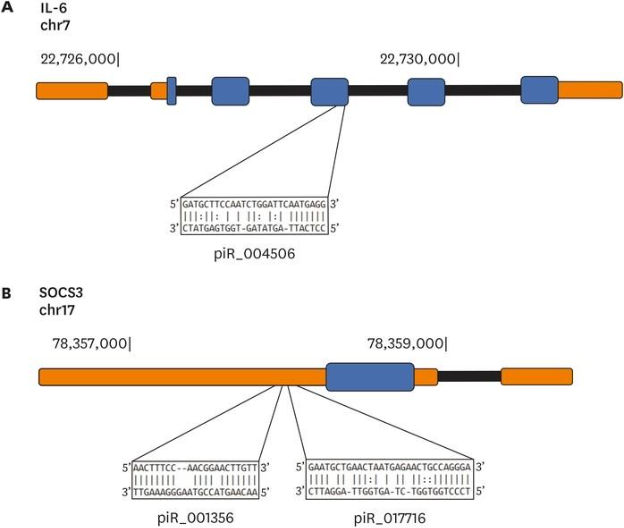
Figure 1. Mapping differentially expressed piRNAs to specific genetic regions of IL6 and SOCS3.
The targets of differentially expressed piRNAs in PHCF challenged with T. cruzi were computationally predicted using the miRanda algorithm. In the genetic cartoons, exons represented by blocks (blue) are connected by horizontal lines representing introns, while the 5′ and 3′ UTRs are represented as thinner blocks (orange) at the extremities of each gene, respectively. (A) IL6 gene cartoon (5′ to 3′ orientation) showing the position where the differentially expressed piR_004506 is predicted to map. (B) Cartoon of SOCS3 gene (3′ to 5′ orientation) showing positions where known piRNAs piR_001356 and piR_017716 map to the 3′ UTR region of SOCS3.
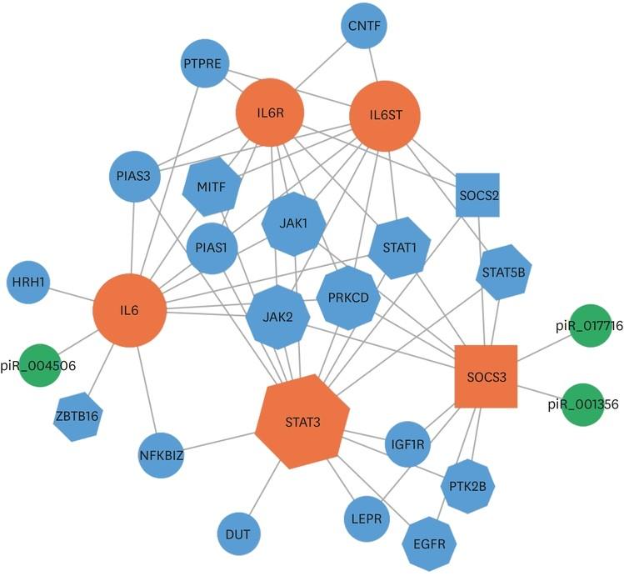
Figure 5. Biological interaction network of IL-6 signaling proteins. Network constructed based on genes from GeneMANIA using IL6, IL6R, gp130/IL6ST, STAT3, and SOCS3 as the query input. The gray connections represent protein-protein and pathway-level interactions between the query proteins and the expanded gene set. Predicted piRNA interactions are highlighted in orange. Molecular entities were categorized into type (node color), degree of connection to other nodes (node size), and molecular function (node shape).